Introduction

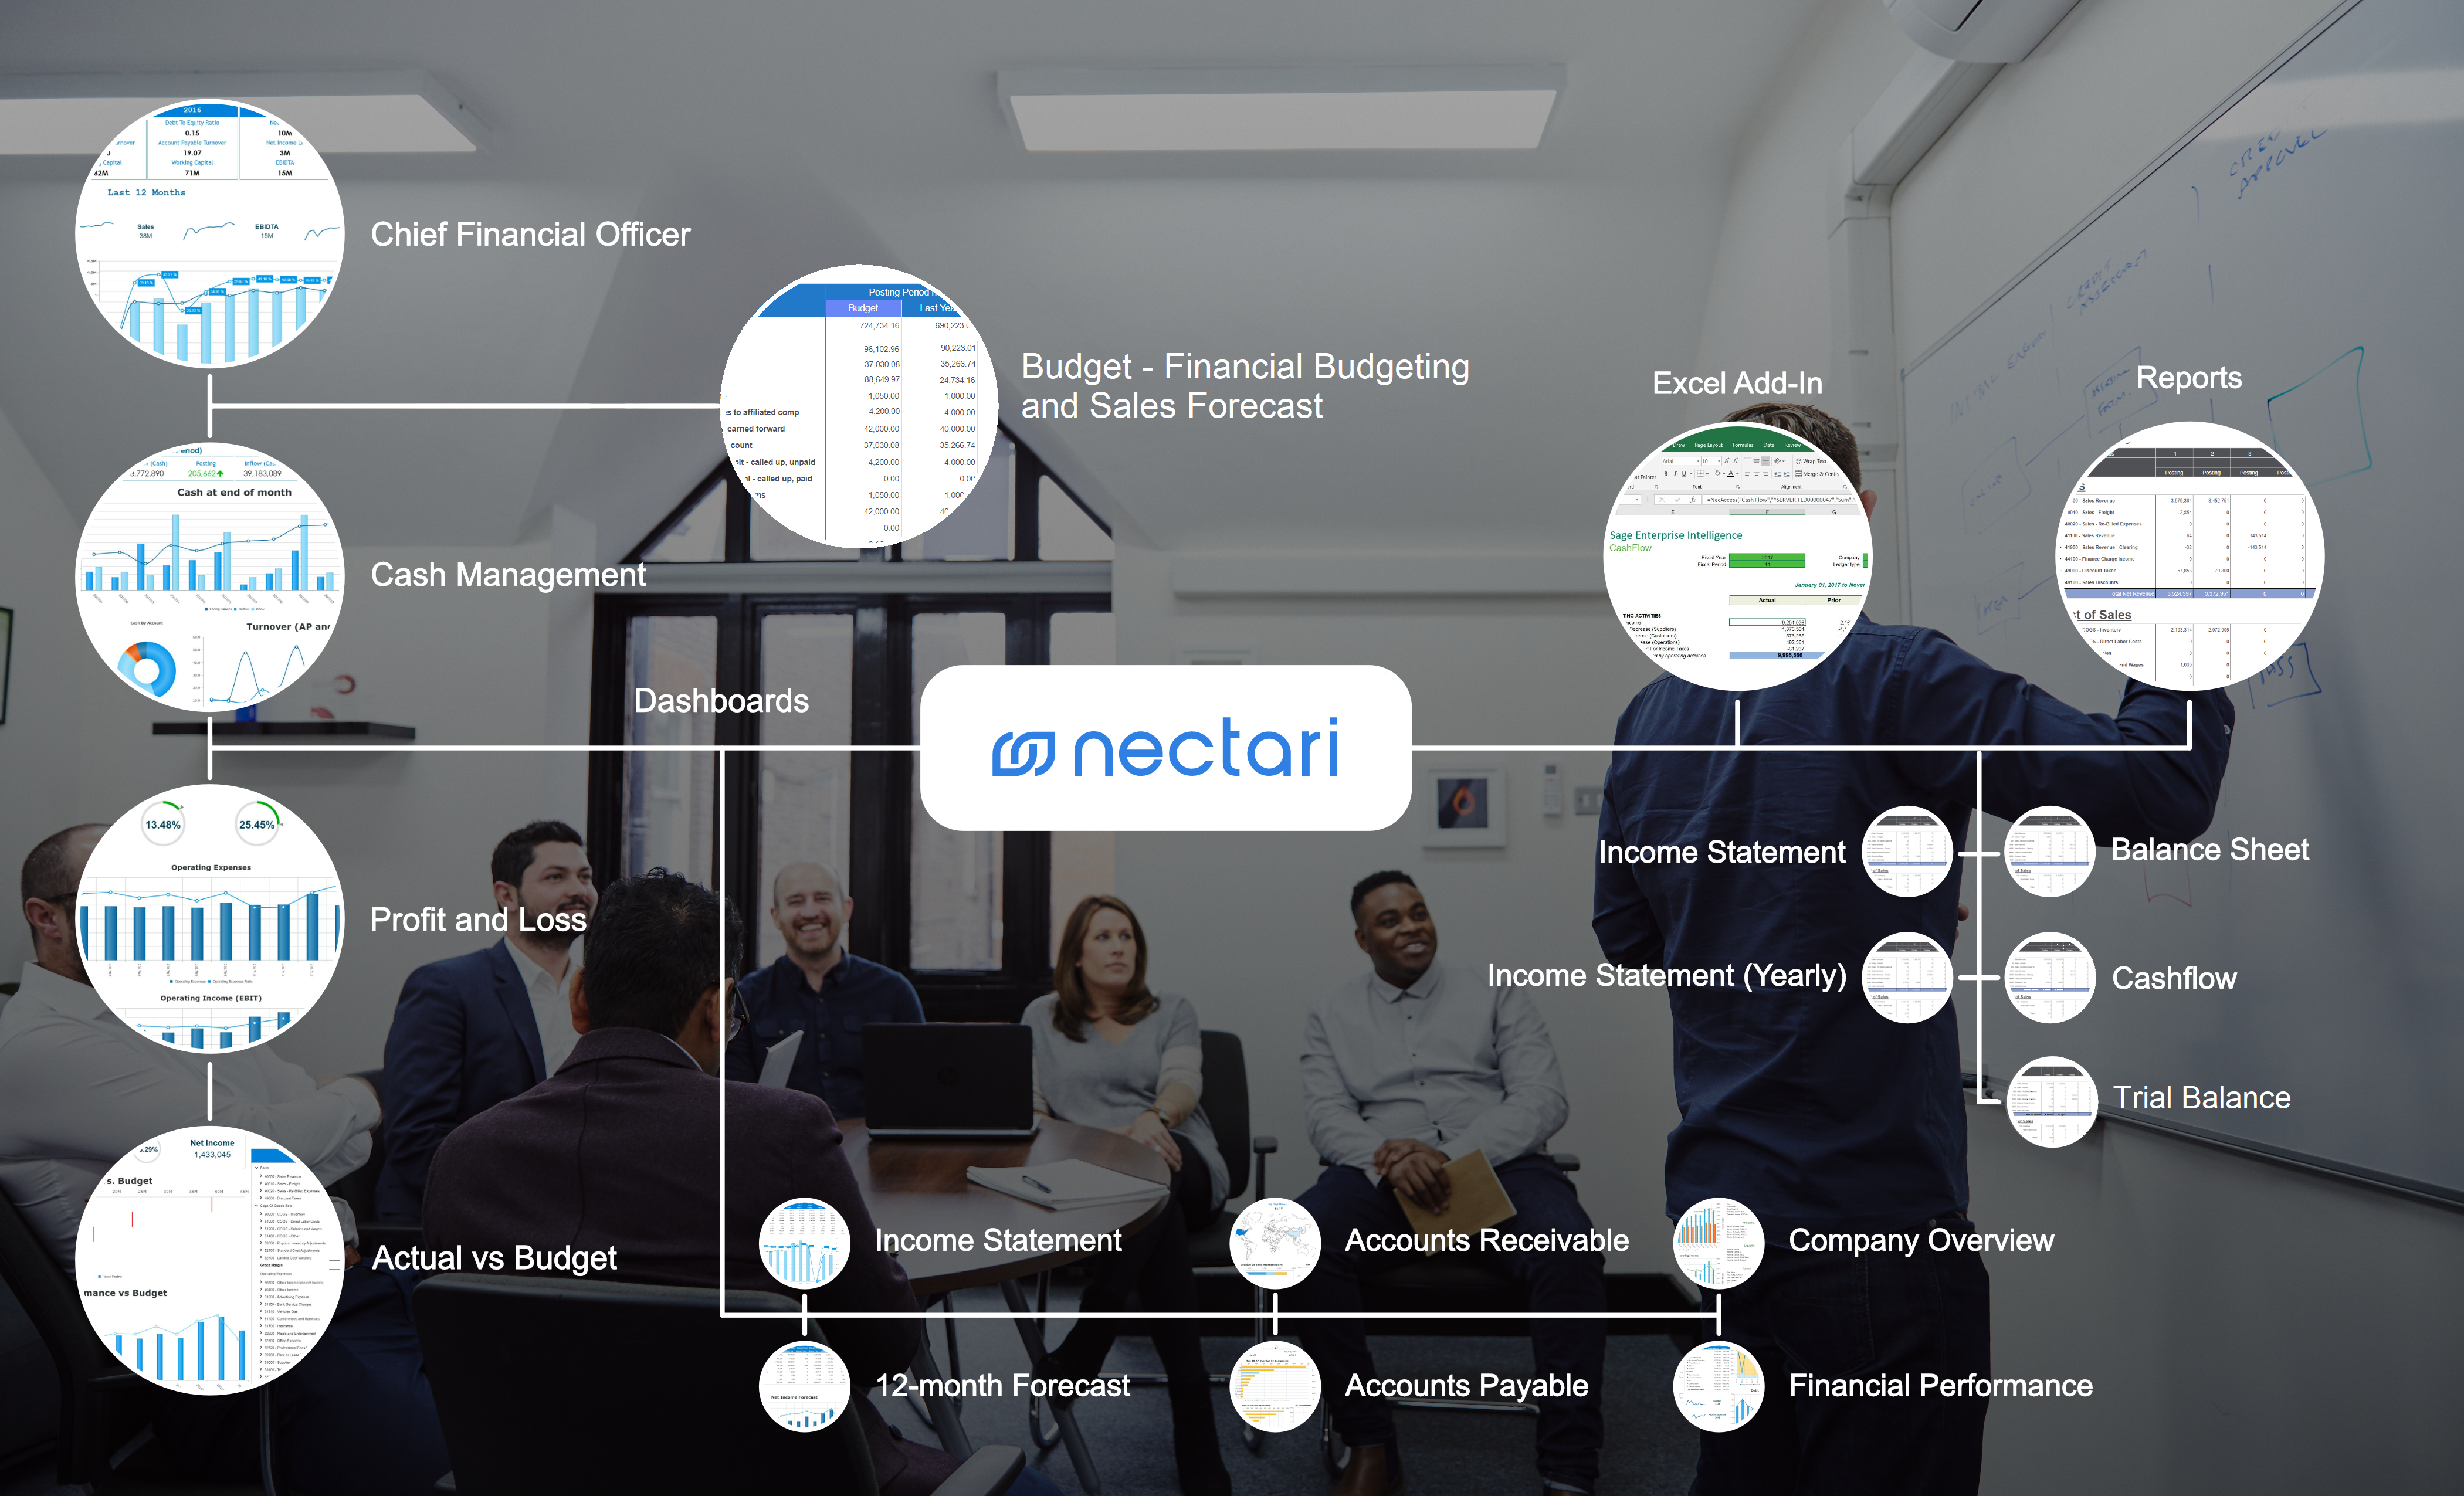
The Solution for Better BINectari is a robust business intelligence solution that covers all your reporting and data analysis needs from Day 1. Serving as a central hub for all data sources, Nectari simplifies the process of accessing and collecting information, then turns that information into actionable insights for smarter business decisions. The Universal Finance Data Model presented throughout this document demonstrates the power of having access to well over 100 KPIs that follow financial business reporting standards. Whether you use the predefined dashboards and reports, or choose to easily create your own, Nectari ensures that you’re equipped with everything you need for analyzing your enterprise’s financial activities, performance, liquidity, and profitability. With minimal set-up required, boosting your enterprise’s performance begins the day you make the decision to work more efficiently with Nectari’s streamlined process for accessing, gathering, consolidating, and organizing data. Hit the ground running today with the financial information you need at your fingertips! |
Available For
Coming Soon
|
||||||||||


Universal Finance Data Model
Finance Budget Model

BudgetingAllocate your company's financial resources and create targets that will help your business grow with Nectari's Budgeting functionality.
|
Integrating Your Forecast with Your BudgetIntegrate your sales forecasting with your financial budget seamlessly with Nectari. Map your sales forecasts within the appropriate GL accounts (ex: by product line) based on the criteria of your choice (ex: product line, territory, country). |

Dashboards

Chief Financial Officer

SummaryThe Chief Financial Officer dashboard provides a global view of the company’s financial situation by comparing the results against last year’s, including key financial measures such as (Return on Assets, Working Capital and Debt to Equity Ratio). AudienceChief Executive Officer (CEO) Chief Financial Officer (CFO) Chief Operating Officer (COO) Features
|
|

Company Overview

SummaryThe Company Overview dashboard provides a global view of the company’s financial situation based on the last 12 months. It offers a vast number of KPIs to evaluate the company’s financial health. AudienceChief Executive Officer (CEO) Chief Financial Officer (CFO) Chief Operating Officer (COO) Features
|
|

Cash Management

SummaryThe Cash Management dashboard provides an overview of the cash flow situation. The dashboard allows the CFO to plan the liquidity needs ahead of time. AudienceChief Financial Officer (CFO) Treasurer Features
|
|

Profit and Loss

SummaryThe Profit and Loss dashboard provides a global view of the company’s results over time and compare with last year results. It provides an assesment on the company financial performance. AudienceChief Executive Officer (CEO) Chief Financial Officer (CFO) Chief Operating Officer (COO) Features
|
|

Financial Performance

SummaryThe Financial Performance dashboard provides key information in order to evaluate the company’s financial strength. It gives an assessment of the financial future of the company. AudienceChief Executive Officer (CEO) Chief Financial Officer (CFO) Chief Operating Officer (COO) Features
|
|

Income Statement

SummaryThe Income Statement dashboard provides an overview of the Net Income Evolution over the last 12 months. AudienceChief Executive Officer (CEO) Chief Financial Officer (CFO) Chief Operating Officer (COO) Company Shareholders Features
|
|

Actual vs Budget

SummaryThe Actual vs Budget dashboard provides an overview of the company performance versus the budget goals. This dashboard allows the management team to analyze the budget variance for different analytical axes. AudienceChief Executive Officer (CEO) Chief Financial Officer (CFO) Chief Operating Officer (COO) Features
|
|

Accounts Receivable

SummaryThe Accounts Receivable dashboard provides an overview of all the overdue receivables and the efficiency of the accounts receivable management. This dashboard helps you improve company liquidity. AudienceChief Financial Officer (CFO) AR Manager Collection Manager Features
|
|

Accounts Payable

SummaryThe Accounts Payable dashboard provides an overview of all the overdue payables and the efficiency of the accounts payable management. AudienceChief Financial Officer (CFO) AP Manager Features
|
|

Cash Management Forecast

SummaryThe Cash Management Forecast dashboard displays the future cash flow situation until the year’s end, giving the CFO insight on company liquidity needs. AudienceChief Financial Officer (CFO) Treasurer Features
|
|

Reports

Income Statement

SummaryAlso known as the Profit and Loss statement or Statement of Revenue and Expenses. Broken into three main sections (Sales, Cost Of Sales and Expenses), the Income Statement reports the company performance. AudienceShareholders Financial Analysts Financial Institution Features
|
|

Balance Sheet

SummaryShow the company’s assets, liabilities and shareholders’ equity at a specific point in time. Broken into three main sections (Assets, Liabilities and Shareholder Equity), the Balance Sheet provides you with a snapshot of what your company owns and owes, as well as the amount invested by shareholders. AudienceShareholders Financial Analysts Financial Institution Features
|
|

Cash Flow

SummaryShow the net amount of cash and cash-equivalents being transferred in and out of a business. Broken into three main sections (Cash From Operation, Cash From Investing and Cash From Financing) the Cash Flow shows the company’s ability to create value for shareholders. AudienceShareholders Financial Analysts Financial Institution Features
|
|

Trial Balance

SummaryThe Trial Balance gives you the balances of all accounts to help you identifying if all the entries in a company’s bookkeeping system are mathematically correct. AudienceChief Financial Officer (CFO) Controller Features
|
|

Key Performance Indicators

Activity

Activity
Account Payable TurnoverShows investors how many time per year the company pay its average payable amount. (Cogs + Inventory) / Average Accounts Payable |
Cash to Cash CycleExpresses the length of time, in days, that it takes for a company to convert resource inputs into cash flows. DIO + DSO - DPO |
Days Payable Outstanding (DPO)Measures how long it takes a company to pay its invoices from trade creditors, such as suppliers. Accounts Payable / (Cost of sales x 365 |
Account Receivable TurnoverShow the number of times per year that a business collects its average accounts receivable. Sales / Average Receivable |
Days of Inventory Outstanding (DIO)Measure of a company’s performance that gives investors an idea of how long it takes a company to turn its inventory. (Average Inventory / Cost of Sales) x 365 |
Inventory TurnoverNumber of times that inventory is sold or used over the course of a year. Sales / Average Inventory |
Average Collection PeriodMeasure the effectiveness of a company’s ability to collect payments from its credit customers. 365 / Accounts Receivable Turnover |
Days of Sales Outstanding (DSO)Measure of the average number of days that it takes a company to collect payment after a sale has been made. (Accounts Receivable / Sales) x 365 |
Total Asset TurnoverShows how much sales are earned for each dollar invested in assets. Sales / Assets |
Leverage

Leverage
Debt RatioAssess company leverage by measuring what proportion of company assets are financed by debt. Liabilities / Assets |
Debt to Asset RatioMeasures the company’s assets financed with debt. Assets / Liabilities |
Debt to Capital RatioMeasures a company’s capital structure, financial solvency, and degree of leverage, at a particular point in time. Liabilities / (Liabilities + Total Equities) |
Debt To Equity Ratio (D/E)This ratio indicates how much shareholder equity and debt is financing a company’s assets and is used to evaluate how much risk a company is taking. Liabilities / Total Equity |
Financial Leverage RatioMeasure of how much assets a company holds relative to its equity. Long-term Liabilities / Total Equities |
Long-Term Debt To Equity RatioDetermine the leverage a business has taken on. Long-term Liabilities / Total Equities |
Profitability

Profitability
EBITDAEarnings before interest, taxes, depreciation and amortization. Sales - Cogs - Operating Expenses + Amortisation |
Net Profit MarginShows how much % of profit generated by the Sales in a company as revenue translates into profit. Net Income / Sales |
Operating Income (EBIT)Earnings Before Interest & Taxes, indicator of a company’s profitability. Sales - Cogs - Operating Expenses |
EBITDA MarginMeasurement of a company’s operating profitability before interest, taxes, depreciation and amortization as a percentage of its total revenue. EBITDA / Sales |
Return on Asset (ROA)Show to a manager, investor, or analyst an idea as to how efficient a company’s management is at using its assets to generate earnings. Net Income / Asset |
Operating income (EBIT) MarginMeasure of a company’s profitability before interest and taxes on sales over a specific time period. EBIT / Sale |
Gross MarginRepresents the percent of total sales revenue that the company retains after incurring the direct costs associated with producing the goods and services it sells. Sales - COGS |
Return on Equity (ROE)Measures a corporation’s profitability by revealing how much profit a company generates with the money shareholders have invested. Net Income / Total Equity |
Gross Margin %Measurement of a company’s gross marging as a percentage of its total revenue. Gross Margin / Sales |
Net IncomeMeasure of how profitable the company is over a period of time. Sales - Cogs - Expenses |
Liquidity

Liquidity
Operating Expenses RatioMeasure of what it costs to operate a piece of property compared to the income that the property brings in. Operating Expense / Sales |
Working Capital RatioShow the ability of a business to pay for its current liabilities with its current assets. Current Assets / Current Liabilities |
Working CapitalMeasure of both a company’s operational efficiency and its short-term financial health. Current Assets - Current Liabilities |
Working Capital TurnoverAnalyze the relationship between the money that funds operations and the sales generated from these operations. Sales / Working Capital |
|
Working Capital RatioMeasures a company’s ability to meet its short-term obligations with its most liquid assets. Current Assets - Inventory - Prepaid Expenses / Liabilities |
Other Measures

Other Measures
AssetsResource with economic value that an individual, corporation or country owns or controls with the expectation that it will provide future benefits |
Current LiabilitiesCompany’s debts or obligations that are due within one year. |
LiabilitiesCompany’s financial debt or obligations that arise during the course of its business operations. |
Retained EarningsPercentage of net earnings not paid out as dividends, but retained by the company to be reinvested in its core business, or to pay debt. |
Total EquityEquity is the value of an asset less the amount of all liabilities on that asset. |
COGSDirect costs attributable to the production of the goods sold in a company. |
Fixed AssetsLong-term tangible piece of property that a firm owns and uses in its operations to generate income. |
Operating ExpensesExpenses a business incurs through its normal business operations. Often abbreviated as OPEX. |
SalesAmount of money that a company actually receives during a specific period, including discounts and deductions for returned merchandise. |
Long-term LiabilitiesForm part of a section of the balance sheet that lists liabilities not due within the next 12 months including debentures, loans, deferred tax liabilities and pension obligations. |
Current AssetsRepresents the value of all assets that can reasonably expect to be converted into cash within one year. |
InventoryRaw materials, work-in-process products and finished goods that are considered to be the portion of a business’s assets that are ready or will be ready for sale. |
Prepaid ExpensesAssets that arise on a balance sheet as a result of a business making payments for goods and services to be received in the near future. |
|
CashUsually includes bank accounts and marketable securities, such as government bonds and banker’s acceptances |